Article Reader
Publish Date:30th July 2013
This article is written in response to questions asked by many who are in US (earning in US$)and who are interested in investing in the Indian stock market (especially using our APS) but their concern is devaluation of rupee.
Every time rupee devalues against dollar it makes a double edged sword impact for investors who have primary asset in US$. First reason, our stock market tanks down each time dollar appreciates against rupee. Second reason, if investors sell off their stocks at that point of time and try to convert back to US$ then they loose at the time of conversion too.
We have found, across longer period of time this is not true and investors are always winner investing in Indian stock market especially when compared to returns from US stock market.
Probable reason behind stock market fall at the time of rupee devaluation is panic driven sell off by large investors. They would like to get out of the market till currency price stabilizes. The moment they notice stability in currency they return back with the same money to the market. Usually they have larger appetite to buy more stocks and finally stock market appreciates faster than it had lost.
Another reason, devaluation of rupee improves exports which turnout to be good for overall economy, hence, it reflects as growth of stock market.
In order to confirm the above assumptions we studied the behaviour of Sensex vs. US$ on the last 15 years data.

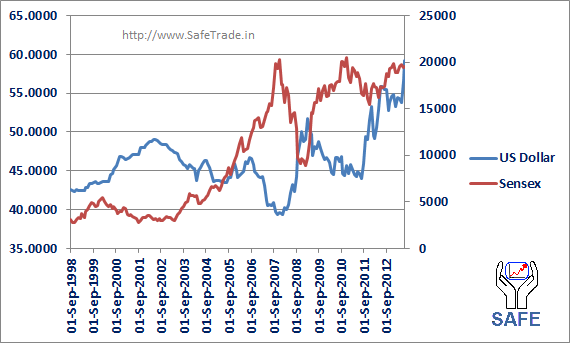
Dollar and Sensex Movement in the Last 15 Years
Make a note of time period between 2001 and 2002. Dollar was at peak and Sensex was at locally lowest value. However, the moment dollar correction started, Sensex jumped by almost 500%. On next upward move dollar went up by a notch from previous height (see time period between 2008 – 2009), Sensex also corrected but it was still at 200% higher value from previous low (during 2001 -2002). Similar pattern repeated in 2011-12 and Sensex responded again in similar fashion (minor correction and then major upward jump).
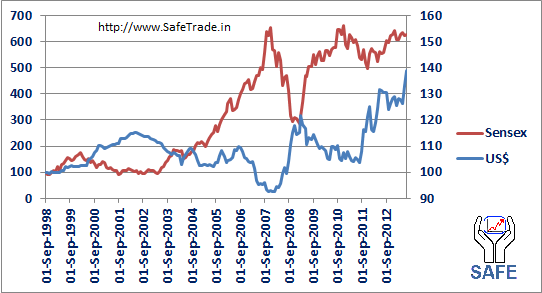
As dollar and Sensex values are at different scale, we are not able to appreciate the speed of Sensex movement in the above chart. We draw another chart as percentage movement of dollar and Sensex from its base (1998).

Percentage Movement of Dollar and Sensex in the Last 15 Years
We can clearly see dollar has appreciated by 40% (or rupee devalued by 29%) in the last 15 years while Sensex’s net movement up is by 500%. $100 in 1998 was equal to Rs. 4250 (approx.). This amount has converted in 2013 to Rs.26710 (assume this money was invested in Sensex). Converting this money back to dollar at current price will be equivalent to $445 (approx.). Still this is 335% growth from the base value of $100. During the same phase in US, S&P has grown by 60%, Dow Jones by 90% and NASDAQ a little over 100%.
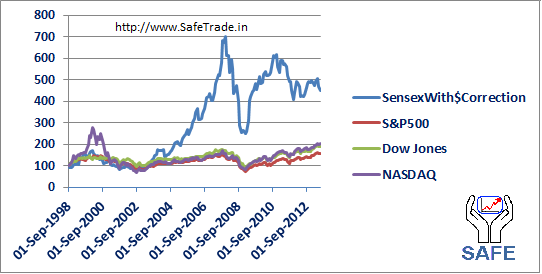
To validate the above findings across time line we also plotted graph of Sensex (with correction in dollar value), S&P500, Dow Jones, and NASDAQ.

Sensex (with correction for rupee) and US Market Indexes
Except 1998-2000 (during dot com bubble), Sensex has outperformed all Indexes and even during 1998-2000 it was lagging behind only NASDAQ.
Conclusion:Devaluation of rupee has just short term panic like situation for investors (US$). Across long term, still Indian stock market has returned much better value than US stock market in spite of rupee devaluation factor.

