APS & Tax Impact
We often get query from our article readers about the impact of tax due to frequent trading in APS (Active Portfolio Service) model of investment. In APS model, investors withdraw their money from falling stocks and only enter when it confirms upward movement (
see Rule-X). This approach definitely increases the number of transactions in comparison to spot investment (buy and sleep). It appears that we must be losing the tax benefit of holding the stock beyond one year (According to tax laws in India, there is 0% tax for capital gain in stock market if one holds a stock for more than a year else it attracts 15% tax on profit)
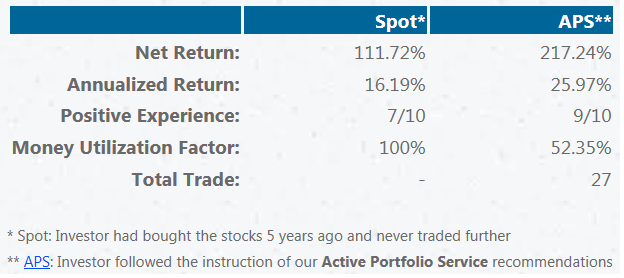
 A typical Profit/Loss Comparison Table, Spot vs. APS
 In our investigation we found this is not true and APS users have either no tax impact or very minimal tax impact. There are mainly two reasons behind the same:
- Normally a profitable trade at APS has longer life and loss making trade mature early. Hence, user do not need to pay for most of the profit making trades
- Some trades which are profitable within a year get compensation against loss making trades which are short lived.
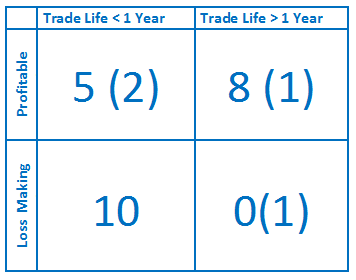
If we compare it with spot investors then it is true they do not need to pay tax at all because most of their holdings are beyond one year. This is one part of the complete story. What about the loss making stocks by spot investors? Yes, they do incur loss in some of the trades but they cannot claim reverse tax benefit for the same. Tax laws only allow carrying forward net loss up to next three years. For an investor who has invested in 10 stocks and 6 of them have made profit while 4 have made loss, if there is net profit then the investor does not claim the reverse tax in the same year or next three years. APS is smartly utilizing the same opportunity to compensate against short term gains. We know some trades are going to make loss, so, we can only have profit against those losses in short term and negate the tax part. It appears to be theoretical. As our policy to validate the concept against reality, we selected a typical balanced portfolio which has yielded around 16% for spot investors and APS model has returned around 28% for the same. 10 stocks portfolio with 10 lakh initial capital (to keep things simple). Total trade across 5 years in APS model was 27. Breakup of the same has been summarized in the following matrix.
 Numbers in Brackets Represent Open Trade
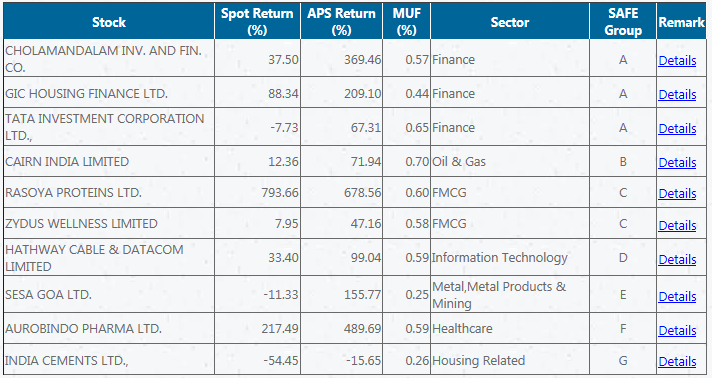
 Following table is showing portfolio structure at end of 5th year
 Profit/Loss Breakup at Each Stock
 More details about the portfolio analysis is available at following link
http://safetrade.in/PortfolioAdvisorAnalysis.aspx?AnalysisID=1924 Following table has recorded the year wise taxable profit/loss information and final tax liability
| Year | Taxable Profit/Loss | Cummalative | Tax (@15%) |
| 2008-09 | -21108.04 | -21108.04 | 0 |
| 2009-10 | 17028.59 | -4079.45 | 0 |
| 2010-11 | 71269.73 | 67190.28 | 10078.54 |
| 2011-12 | -121887.90 | -54697.62 | 0 |
| 2012-13 | 36291.90 | -18405.72 | 0 |
| 2013-14 | 102852.41 | 84446.69 | 12667.00 |
We can see investor has only paid tax two times in 5 years and the total amount of tax paid is Rs.22,746/-, which is nearly 2.3% of initial working capital. APS has generated extra Rs.10,55,200/- in comparison to spot (
MUF is extra) and for that investor has to pay Rs.22,746/-. This should not be a concern for most of the investors. For detail calculations please download the following file
http://safetrade.in/Articles/APSandTaxImpactDetails.pdf Conclusion: APS model of investment increases number of transactions in comparison to spot investors. However, most of the profit making transactions in APS have longer life than a year (no tax liability) and remaining profitable trades get compensation of tax against loss making trades (which spot investors fail to monetize). So, APS investors finally get either no extra tax burden or very minimal in comparison to value it adds against spot investors.


